
Nut Beat Report: The trees have already started next season
California almonds, pistachios and walnuts, measured on the trees. Not modeled.
1,451 almond blocks · 567 pistachio blocks · 98 walnut blocks · Jul 1 – Oct 12
October 12, 2026

Orchard harvest seen from above
Jul 1 – Oct 12 at a glance
4.6 in ETo, last 4 weeks
28% of harvested almonds already recovering
60% of pistachio blocks finished
48% of walnut blocks in the harvest break
— HOW WE KNOW
Measured across California, in real time.
Every number in this report comes from live sensors on 2,116 California nut blocks. That is how we see what is happening across the Valley as it happens, not weeks later.
Monitoring tells you a trunk stopped growing. Ten years of watching these same trees respond tells us what that means for the crop and what to do next: bring water back to 70% of ETo within a week of pickup, then confirm it worked when the trunk line turns up. Data growers act on, the same week.
Almonds · After harvest
Are your orchards regrowing after shake?
Trunk growth is back: 28% of almond orchards are recovering after harvest.
A trunk that begins growing again after harvest is a good sign the tree is recovering and rebuilding for next season, and that is the response we want to see. Recovery still runs north to south: 51% of South San Joaquin orchards are already there, against 9% in the Sacramento Valley, where harvest ran later and nights are cooler. Water separates the two groups only in the south: 57% recovered at 70% of ETo or more, against 38% below it.
Trunk growth after harvest

Illustration drawn from each group’s measured median trunk-growth rate · recovery pace = 1+ mil/day (1 mil = 0.001 in)
Where orchards are recovering, and how much water helped

Recovering = 1+ mil/day of trunk growth since harvest · water = metered ÷ ETo, Sep 27 – Oct 12 · regions by orchard location
Do this: Bring water back to at least 70% of ETo within a week of pickup, and watch for the trunk line to turn up.
Pistachios · Harvest
Where does pistachio harvest stand?
Pistachio harvest is winding down: 60% of blocks are finished.
Only 12% haven’t started, and 28% are still in the harvest break. The north is furthest along, with 82% of North San Joaquin blocks done, against 53% in the Sacramento Valley. Trees stayed calm through it: 10% of blocks had three or more stress days in the last two weeks.
Pistachio harvest, by region

Status on Oct 12 · shading = share of blocks past harvest · in harvest = in the harvest break now · regions by orchard location
Do this: Once the last shake is done, get water back on within days. The leaves still have weeks of work ahead.
Walnuts · Harvest
Where does walnut harvest stand?
Walnut harvest is at its peak, and the stress is in the north.
Just under half of walnut blocks are in the harvest break, 46% are done and 6% haven’t started. The Sacramento Valley, which carries most of the crop, is in the thick of it, with 56% of blocks mid-harvest. That’s where the stress is: 45% of Sacramento Valley blocks had three or more stress days in the last two weeks, against 19% in the Central San Joaquin.
Walnut harvest, by region
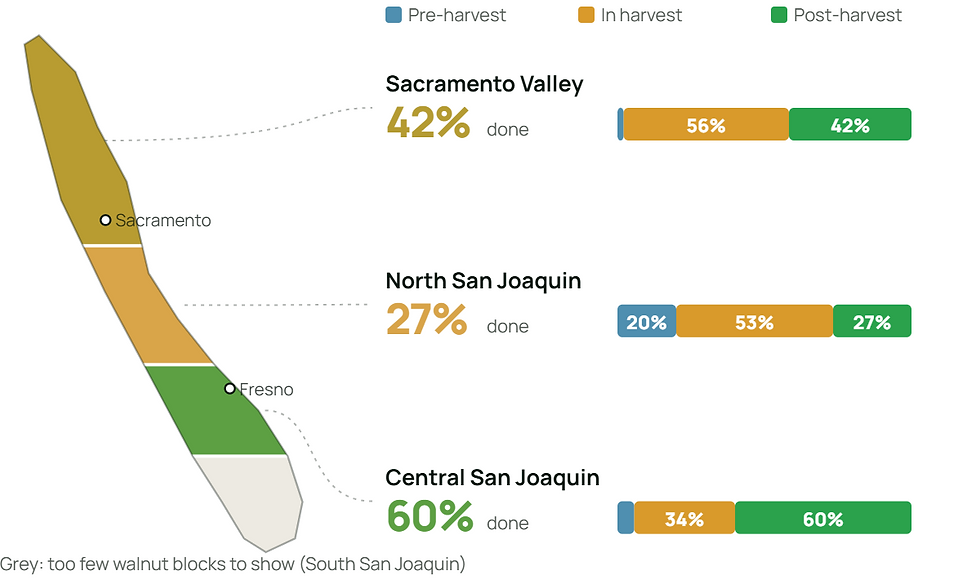
Status on Oct 12 · shading = share of blocks past harvest · in harvest = in the harvest break now · regions by orchard location
Do this: Keep the pre-harvest dry-down as short as the shaker allows, and get water back on the same week as pickup.
Not yet a Phytech customer? Schedule a demo →
Already on Phytech? Talk to your CSM →
Almonds · Pistachios · Walnuts · Block-specific plant demand benchmarks
Moving beyond a standard Kc
Healthy orchards stayed green on 20–30% less water than a standard Kc calls for.
Over the last four weeks, healthy almond blocks applied 83% of ETo against a standard Kc of 102%, pistachios 70% against 95%, and walnuts 72% against 97%. The point isn’t that trees need less water. It’s that each block’s own plant response is a sharper guide than a statewide coefficient, and how the water goes on matters as much as how much.
Applied water includes system losses. Blocks with meter gaps were left out. Walnuts are a smaller sample.
Water applied on healthy blocks vs a standard Kc
● one healthy block · | median (number on the right) · ▲ median of stressed blocks

Metered water ÷ reference ET · Sep 13 – Oct 12 · ETo ≈ 4.6 in · healthy = green 90%+ of days, never red · standard Kc for mature orchards: almond 1.02 (UC, Sanden 2007), pistachio 0.95 (UC, Goldhamer 1992), walnut 0.97 (UC, Goldhamer 1996; Fulton 2011)
Do this: Use your healthy blocks’ measured share of ETo as your October benchmark, then let the plant readings tell you when to adjust.
Almonds · Pistachios · Walnuts · Water and energy
Where is post-harvest water going?
Long sets are where the water escapes.
Almond sets of 16–30 hours pushed water below 2 ft nearly half the time (48%), against 9% of sets under 8 hours. On about the same water, blocks irrigating four or more times a week on ~5-hour sets sent a third as much water that deep as blocks on one ~23-hour set, and grew more trunk.
On energy, most growers already avoid the 4–9 PM peak: 15% of pumping hours fell there, below the 21% an even spread would give. Still, one in thirteen almond blocks and one in six pistachio blocks ran a quarter or more of their pumping in peak hours.
How deep the water went

Measured by soil sensors at each irrigation · Sep 13 – Oct 12
Same water, split differently: almonds

Almond blocks that received 55–95% of ETo over the last four weeks, so total water is about the same in every row · median per group
When the pumps ran: September, by hour

Measured from irrigation events, all three crops · share of pumping hours by hour of day · Sep 13 – Oct 12
Do this: Split long sets into two or three shorter ones a week, aim for the water to stop around 2 ft, and schedule them outside 4–9 PM.
— WHAT THIS IS WORTH
Water below the roots and pumping at peak rates are the two costs you can cut.
The Water and energy card above is measured, not estimated. Soil sensors caught almond sets of 16–30 hours pushing water below 2 ft nearly half the time, and 15% of pumping hours ran in the 4–9 PM peak. Water that passes the root zone is bought, pumped and gone, and it takes the fertilizer with it.
Phytech growers see each set’s depth and timing the next morning, so the next set is shorter, split and off-peak. Over a season that shows up on the water bill and the power bill, with more trunk growth to show for the same water.
Almonds · Season recap
2026 vs 2025
Almond trunks grew less this spring, and it wasn’t for lack of water.
Same blocks, one year apart. From April to June, almond water kept pace with demand and trees were less stressed than in 2025, yet trunks grew 12–15% less, most likely from the early March start or crop load. Pistachios held level with 2025, helped by a strong May flush that our field teams saw especially on light-crop trees.
Almonds, month by month vs 2025

Same blocks both years · change vs the same month of 2025
Almonds, spring (April–June) vs 2025, by region

Same blocks both years · April–June totals
Do this: If your spring growth fell while stress stayed low, more water won’t fix it. Check crop load and early-season timing before changing next year’s plan.

Every number analyzed in this month’s issue of Nut Beat comes from sensors like this one, measuring the tree itself.
How we built the data
Every California almond (1,451 blocks, 181 growers), pistachio (567 blocks, 80 growers) and walnut (98 blocks, 31 growers) block with steady trunk-gauge, irrigation and ETo data since July 1, trees 5+ years. Data to Oct 12. Harvest stage is read from each block’s irrigation and plant-sensor record. Year-on-year comparisons use only blocks with full records in both 2025 and 2026. Trunk growth is in mils (thousandths of an inch). All figures are aggregated; no grower or block can be identified.
Want your own orchards read this way? Your Phytech agronomist can walk you through them.
Not yet a Phytech customer? Schedule a demo →
Already on Phytech? Talk to your CSM →
Smart farms run on phytech.com
10 years of reporting. Over 10 million trees monitored across California.
Comments