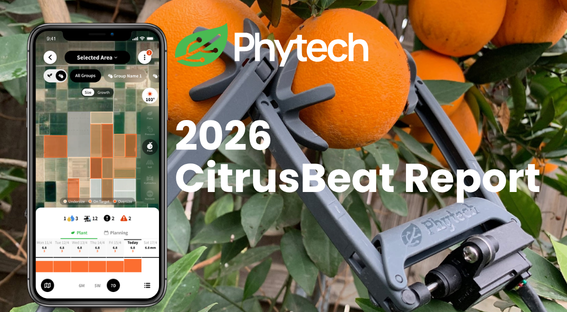
Big Update (23 Feb.26): High-Res Satellite Imaging, Pests GDD Report, Climate Station Naming
- Phytech Team

- Feb 24
- 2 min read
We are excited to introduce a major update: High-Resolution Satellite Imaging in Phytech , released as part of Feb. 23 product update together with:
New report: Insights Pests GDD (Western USA)
Add Climate Station Name to Current Weather Widget

Check out the full release:
High-Resolution Satellite Imaging in Phytech
What’s new
High-Resolution Satellite Imaging is now available inside the Phytech platform as a separate add-on feature — giving growers near-daily, high-clarity satellite views (10 ft² resolution) of their fields.
Why It Matters
Seeing differences across a field from the ground can be hard — especially before issues impact yield.
Spot problems early — detect anomalies such as irrigation malfunctions or stress patterns that aren’t obvious on the ground.
Visualize variability within blocks — not just at a coarse scale, but at actionable, field-relevant resolution.
Prioritize scouting and inputs — know where to send crews, check infrastructure, and make corrective moves with data.
Track seasonal trends — view up to 3+ years of image history to understand patterns over time.
The Phytech Diffrence
Higher Frequency: Near-daily imagery — updated frequently to keep you in step with changes as they happen, not weeks later.
Higher resolution — 10 ft² detail reveals variability within blocks, giving you greater clarity than traditional satellite layers.
Integrated inside Phytech — imagery and analytics appear with your other crop insight layers so you don’t have to switch tools.
Actionable layers — see vegetation development, canopy moisture (wetness), relative nitrogen content, inter-plot variability, and automatic anomaly detection.
This new capability works across orchards, vineyards, vegetables, and row crops — supporting actionable decisions throughout the season


Insights pests GDD report (Western USA)*
What’s new
A new pests GDD report (Growing Degree Days) to help monitor and prevent major pests across key crops in the Western USA. A daily, cumulative sum of heat units above a specific base temperature, used to track and predict plant and pest development
Why it matters
Enables focused monitoring of specific pests
Provides visibility at both the area and plot level
Displays key developmental stages for each pest based on accumulated degree days
Supports more precise timing of field actions and treatments


*Pls note that the report would be available only for relevant crops in Western US, that might be affected from pests
Add Climate Station Name to Current Weather Widget
You can now name a specific weather station for a clearer orientation


If you like difficult games, Geometry Dash SubZero will keep you hooked for hours.
What I love about Drive Mad is how creative the levels are. Each one pushes your skills slightly further, encouraging improvement while still being fun to experiment with.
I like seeing tech used to spot pest pressure early, especially in farming or large properties where you can miss small changes until they become expensive. Around a house, I think the same idea applies in a more hands-on way: watch the warning signs, check openings, and fix weak spots before rodents settle in. If you want a practical look at sealing those entry points without poison, visit website.
High-resolution satellite imagery: Allows tap tap shots grape growers to monitor the condition of their vineyards in detail, detecting water and pest problems early.
With Geometry Dash, you will immerse yourself in a world filled with neon colors, where every movement depends on the rhythm—delivering a thrilling and incredibly captivating experience.